Our brand
One brand strategy
Brand expression
Power of Priceless
Asset Library
KEY TAKEAWAYS
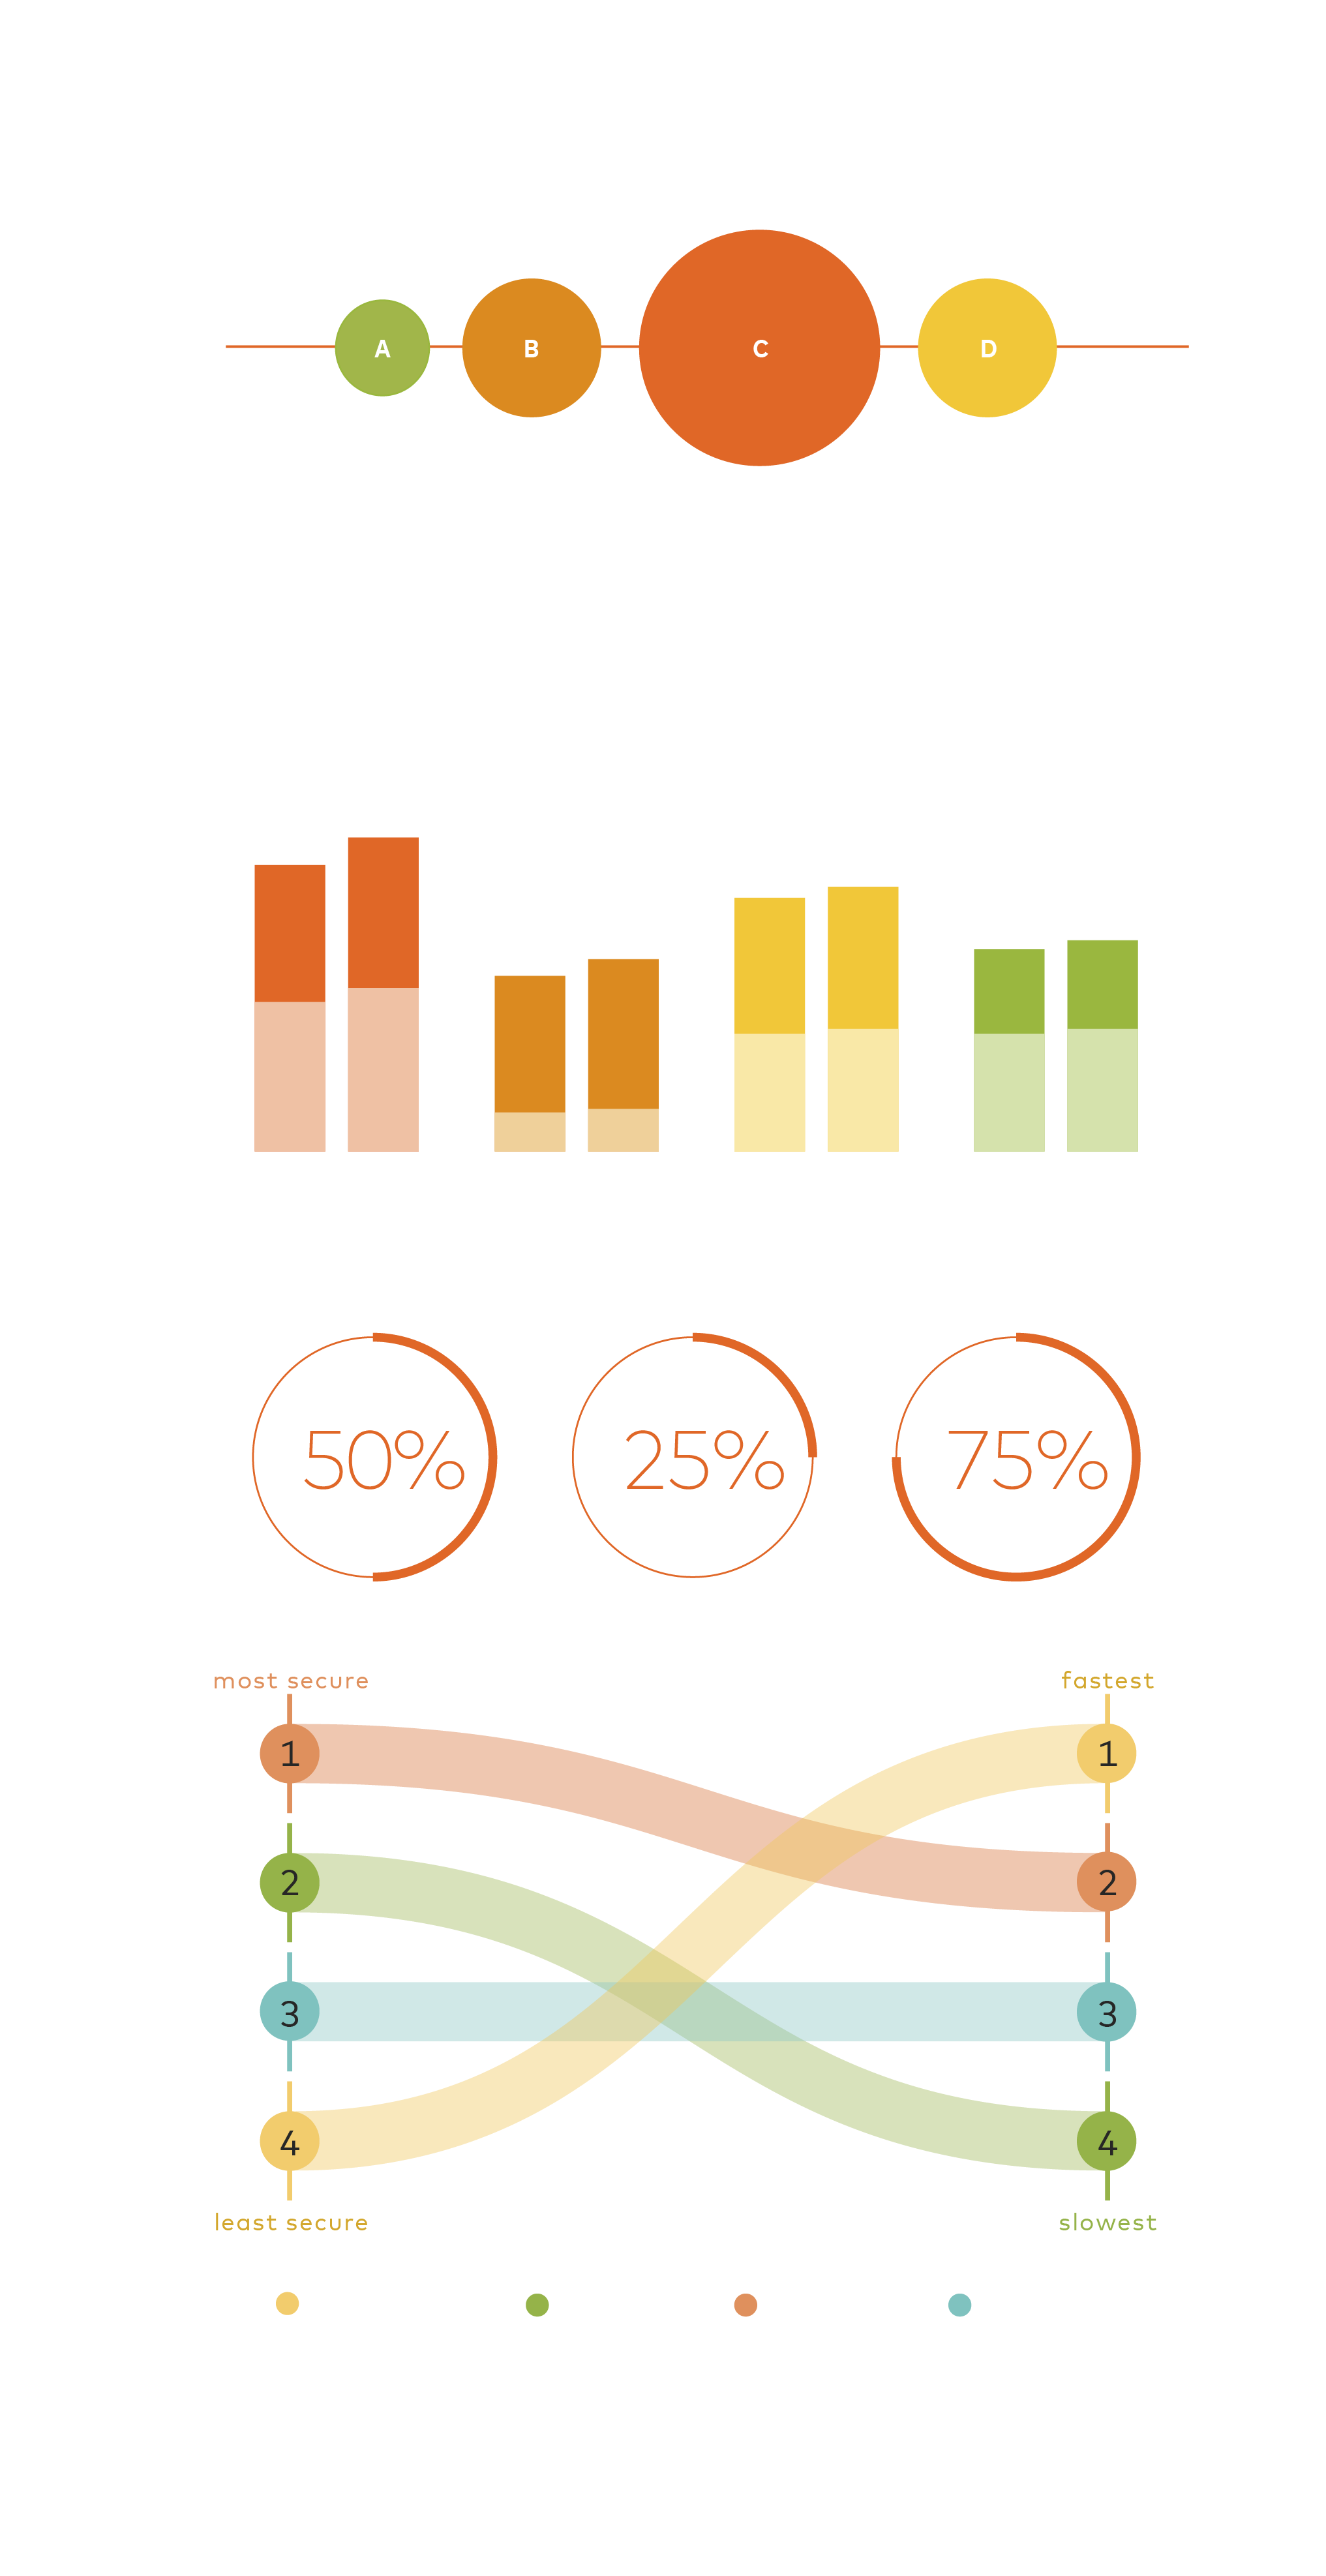
Compare datasets
From stacked bar charts to choropleth maps, we have a suite of charts available to clearly and accurately visualize and compare diverse datasets.
Use accent colors and their tints and shades to emphasize data points and insights.
Simplify concepts
We use information design to explain complex or abstract concepts because it presents information in an easily digestable way.
Essential tools
Telling stories clearly with data is at the heart of what we do. Information design is what helps us bring to life our most compelling insights.
UNIQUELY MASTERCARD
Information design is the meeting point of functionality and creativity. It’s how we showcase some of our most inspiring work and visualize our insights in a forward-thinking yet intuitive way.
DID YOU KNOW?
Data visualization is not a modern phenomenon; it has helped people visualize and record information for centuries. The Mesopotamian Empire used clay tokens to visualize abstract values, while the earliest star maps are over 17,000 years old.